
HPLC Liquid Chromatography Services
High-Pressure Liquid Chromatography, most commonly referred to in the medical, pharmaceutical and manufacturing industries as "HPLC". Chromatography devices are intricate pieces of equipment dedicated to a molecular separation called "columns" and "high-performance" pumps to deliver solvent at a stable flow rate, these are a few of the key components of chromatographs. Chromatographs continue become more sophisticated and are now also referred to as "Peformance Liquid Chromatography" referred to as LC. In today's modern age tey are capable of high-speed analysis and is used amongst a large amount of organizations both large and small.
When it comes to HPLC, only compounds dissolved in solvents can be analyzed. What HPLC does is separate compounds that have been dissolved in a liquid sample to allow quantitative and qualitative analysis of what components and how much of these are contained in the liquid sample.
To speak with the experts about your load cells calibration needs, please fill out our online form or give us a call!
The HPLC Process
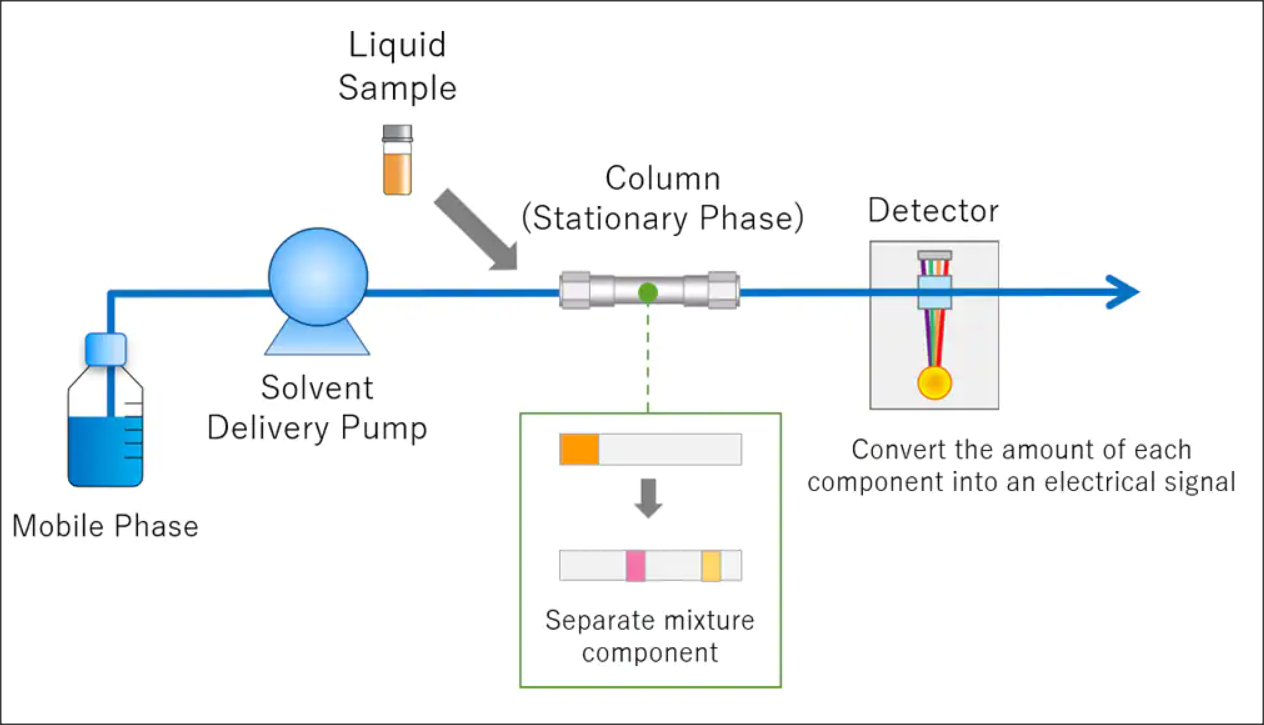
In the figure below the HPLC Process is provided. The first phase is the "mobile phase" where the solvent that is used to separate components in a liquid sample for analysis. It is then deliverd to a separate column, which is referred to as the "stationary phase". After that is goes to the detector at a stable flow rate controlled by a delivery pump. At this point a sample is injected into the column and the compounds in the sample are separated. The compounds that are separated in the column are then detected by a "detector" down the process of the column and each compound is then quantified and identifiable.
HPLC Flow Chart
HPLC Apparatus
In the graph below you will find the basic overview of the HPLC process that is shown in the figure above. As mentioned, HPLC chromatography consists of a variety of components including a solvent delivery pump, a degassing unit, a sample injectory, a column oen, a detector and a processor. Below you will find an HPLC Flow Diagram with the role of the various components.
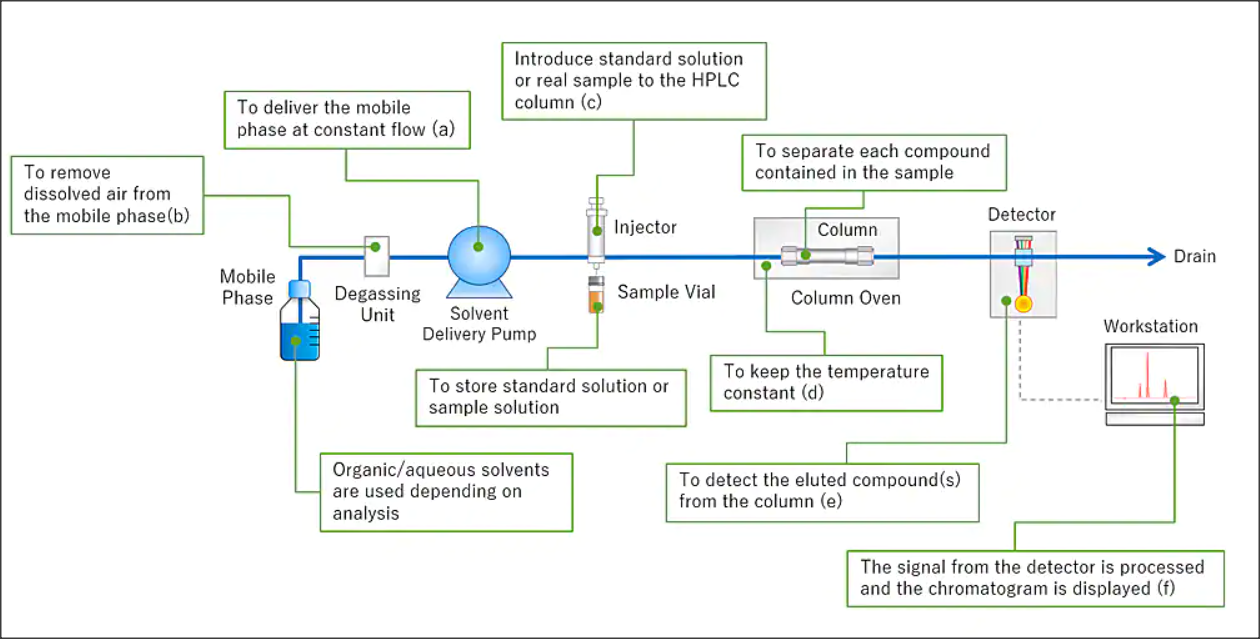
A). The pump delivers the mobile phase at a controlled flow rate. Air will dissolve in the mobile phase under standard atmospheric pressure in which we survive and live. If the mobile phase contains air bubbles and enters the delivery pump, flow rate fluctuations and baselines may occur. T he degassing unit will prevent this issue by removing the air bubbles.
B). Once the dissolved air has been removed, the mobile phase is delivered to the "column". The sample injector at this tage will implement a standard solution into the mobile phase.
C). With the separations of the compounds in the column, temperature fluctuations may affect the separation. The column will be placed in a column oven to keep temperatures steady.
D). Compounds discharged from the column are detected by a detector. This is placed downstream of the column.
E). A Workstation processes the signal from the detector to btain a "chromatogram" to identify and quantify the compounds.
HPLC Separation Process
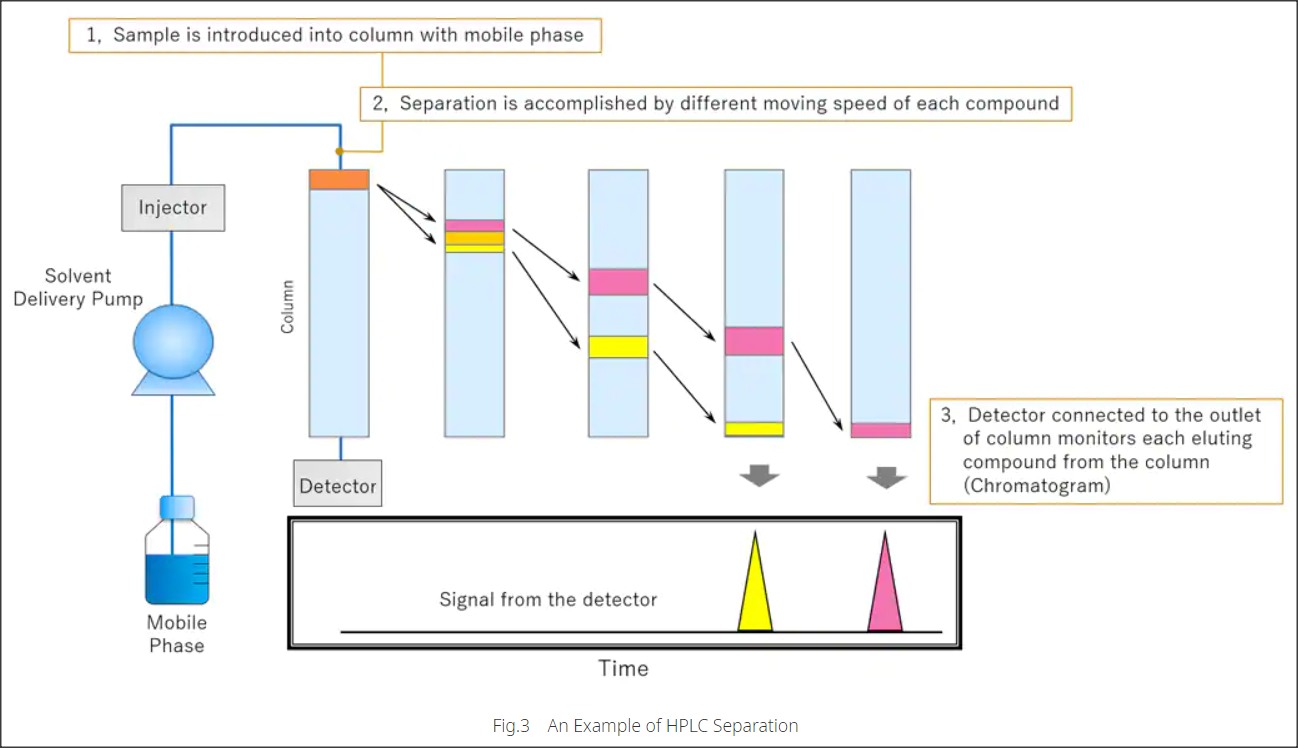
HPLC has the ability to separate and detect each compound by the difference of each compound's speed through the column. See Figure Below.
Again, there are 2 phases for HPLC:
1. The Mobile Phase
2. The Stationary Phase
The mobile phase is the liquid that will dissolve in the target compound. And the stationary phase is the part of the column that will interact with the targeted compound.
In the column, the stronger the affinity between component and the mobile phase, the faster the component will move through the column along with the mobile phase. With that said, the stronger the affinity with the stationary phase, the slower it will move through the column. Below you will see an example in which the YELLOW component has a strong affinity with the mobile phase. Whereas the PINK component has a stronger affinity with the stationary phase and moves slowly. The speed depends on the affinity between the compound and the stationary phase.
How to Read a Chromatogram
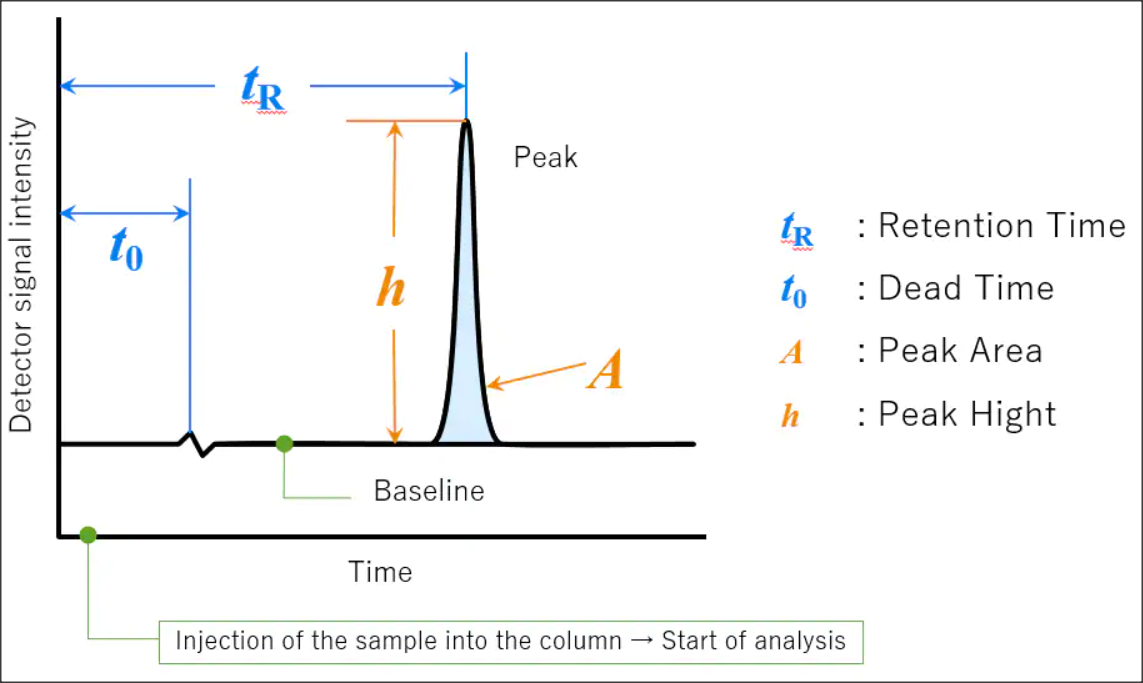
A chromatogram is a plot obtained via chromatography. In the figure below there is an example of a chromatogram. It is a 2-dimensional plot with a vertical axis showing concentration in terms of the detector signal intensity. Along with the horizontal axis representing the analysis time. When no compounds are eluted from the column, a line parallel to the horizontal axis plotted. This is called "baseline". The detector will respond based on the concentration of the target compound in the elution band. The obtained plost is called a "peak".
tR (Retention Time) is the time interval between sample injection point and the apex of the peak. The required time for non-retained compounds, these are compound with no interaction for the stationary phase), to go from the injector to the detected is called "dead time" (t0).
The peak height (h) is the vertical distance between a peaks apex and the baseline, and the peak area (A) colored in light blue is the area enclosed by the peak and baseline. Ultimately, these results will be the qualitative and quantitative analysis of a sample's components.
To speak with the experts about your HPLCneeds, please fill out our online form or give us a call!
San Diego Thermo Scientific HPLC Calibration Company
To request a quote from GL-Tec, please fill out our online form and we will get back to you promptly.
CLICK HERE TO BEGIN